Sprint Ledger: an engineering-manager dashboard.
Sprint Ledger is a dashboard I built with Claude. It rolls each person’s capacity, pace, and open pull requests into a Red, Amber, or Green read, and drafts a starting point for the next one on one.
About the data. This public version of Sprint Ledger runs on simulated data for ten fictional people. It is not connected to GitHub or Jira, and it does not call a language model at runtime. A version connected to live Jira, GitHub, PTO calendar, and sprint capacity-planning data was in use at Fanatics. It ran every hour, used Claude agents to assess the team and suggest topics for one-on-ones, and, because it held evaluations of staff, was visible only to me and senior leadership.
- Project
- Sprint Ledger, an engineering-manager dashboard for a two-week sprint
- Built with
- Claude, using React, TypeScript, Vite, and Vitest
- Data
- Simulated: ten fictional direct reports, seeded so every run is repeatable
- Tests
- 29 unit tests covering the simulation, scoring, and talking points
- Status
- Working prototype
One read on a large team, before the sprint slips.
Leading eight to twenty direct reports means the early signs of trouble are scattered across a sprint board, a pull-request queue, and a leave calendar. A manager needs a fast, consistent answer to three questions: who is carrying more or less than they can, who is falling behind, and whose work is stalling in review.
The answer also has to lead somewhere. A status with no next step is only a color, so the dashboard pairs each one with a written reason and a suggested opening for the one on one.
Three checks decide every status.
| Capacity | Points assigned at the start of the sprint differ from the person’s capacity, which is the sprint’s points adjusted for PTO days. Both under- and over-assignment count. |
|---|---|
| Pace | Points completed differ from expected by more than the tolerance. Expected pace is an even share of the sprint’s points for each available day, with PTO excluded and capped at the person’s assignment. |
| Open PRs | More pull requests are open than the limit, a sign that work is stalling in review. |
Each failed check is one warning. By default, no warnings is Green, one is Amber, and two or more is Red. Points per sprint, the PR limit, both tolerances, and the Amber and Red cut-offs are all editable, as are each person’s name, role, and handles.
Open a person to see why.
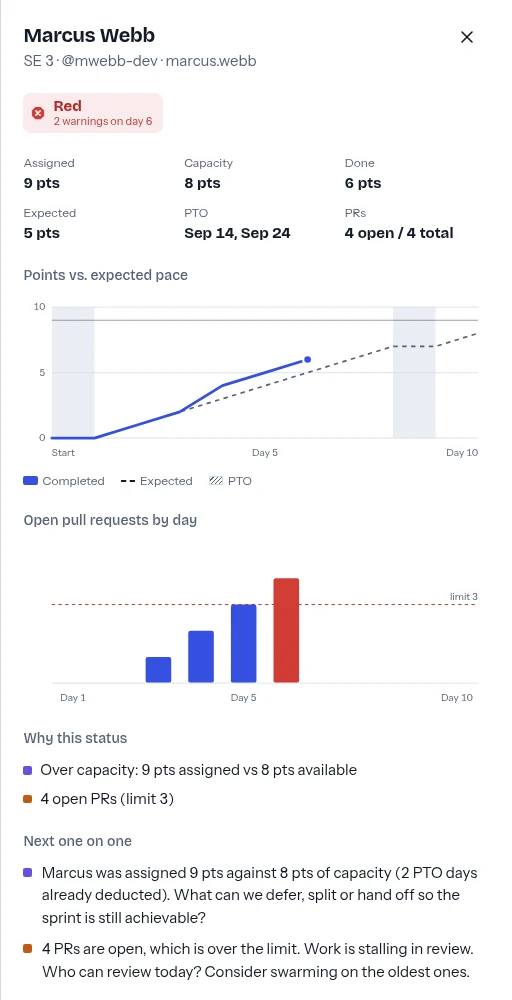
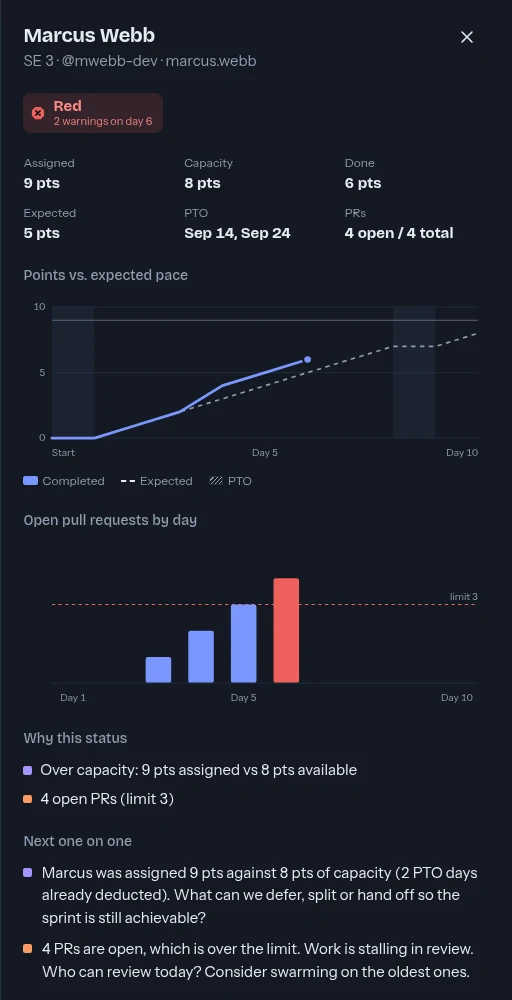
Selecting a lane opens a drawer for that person. It shows the numbers behind the status, a chart of points against expected pace, and open pull requests by day against the limit.
Why this status lists each failed check in plain words, so the rating is never a black box.
Next one on one suggests what to ask, and the wording depends on the role. Junior engineers are offered pairing when they are behind, while senior engineers are asked whether the cause is scope creep or unplanned work such as reviews and incidents.
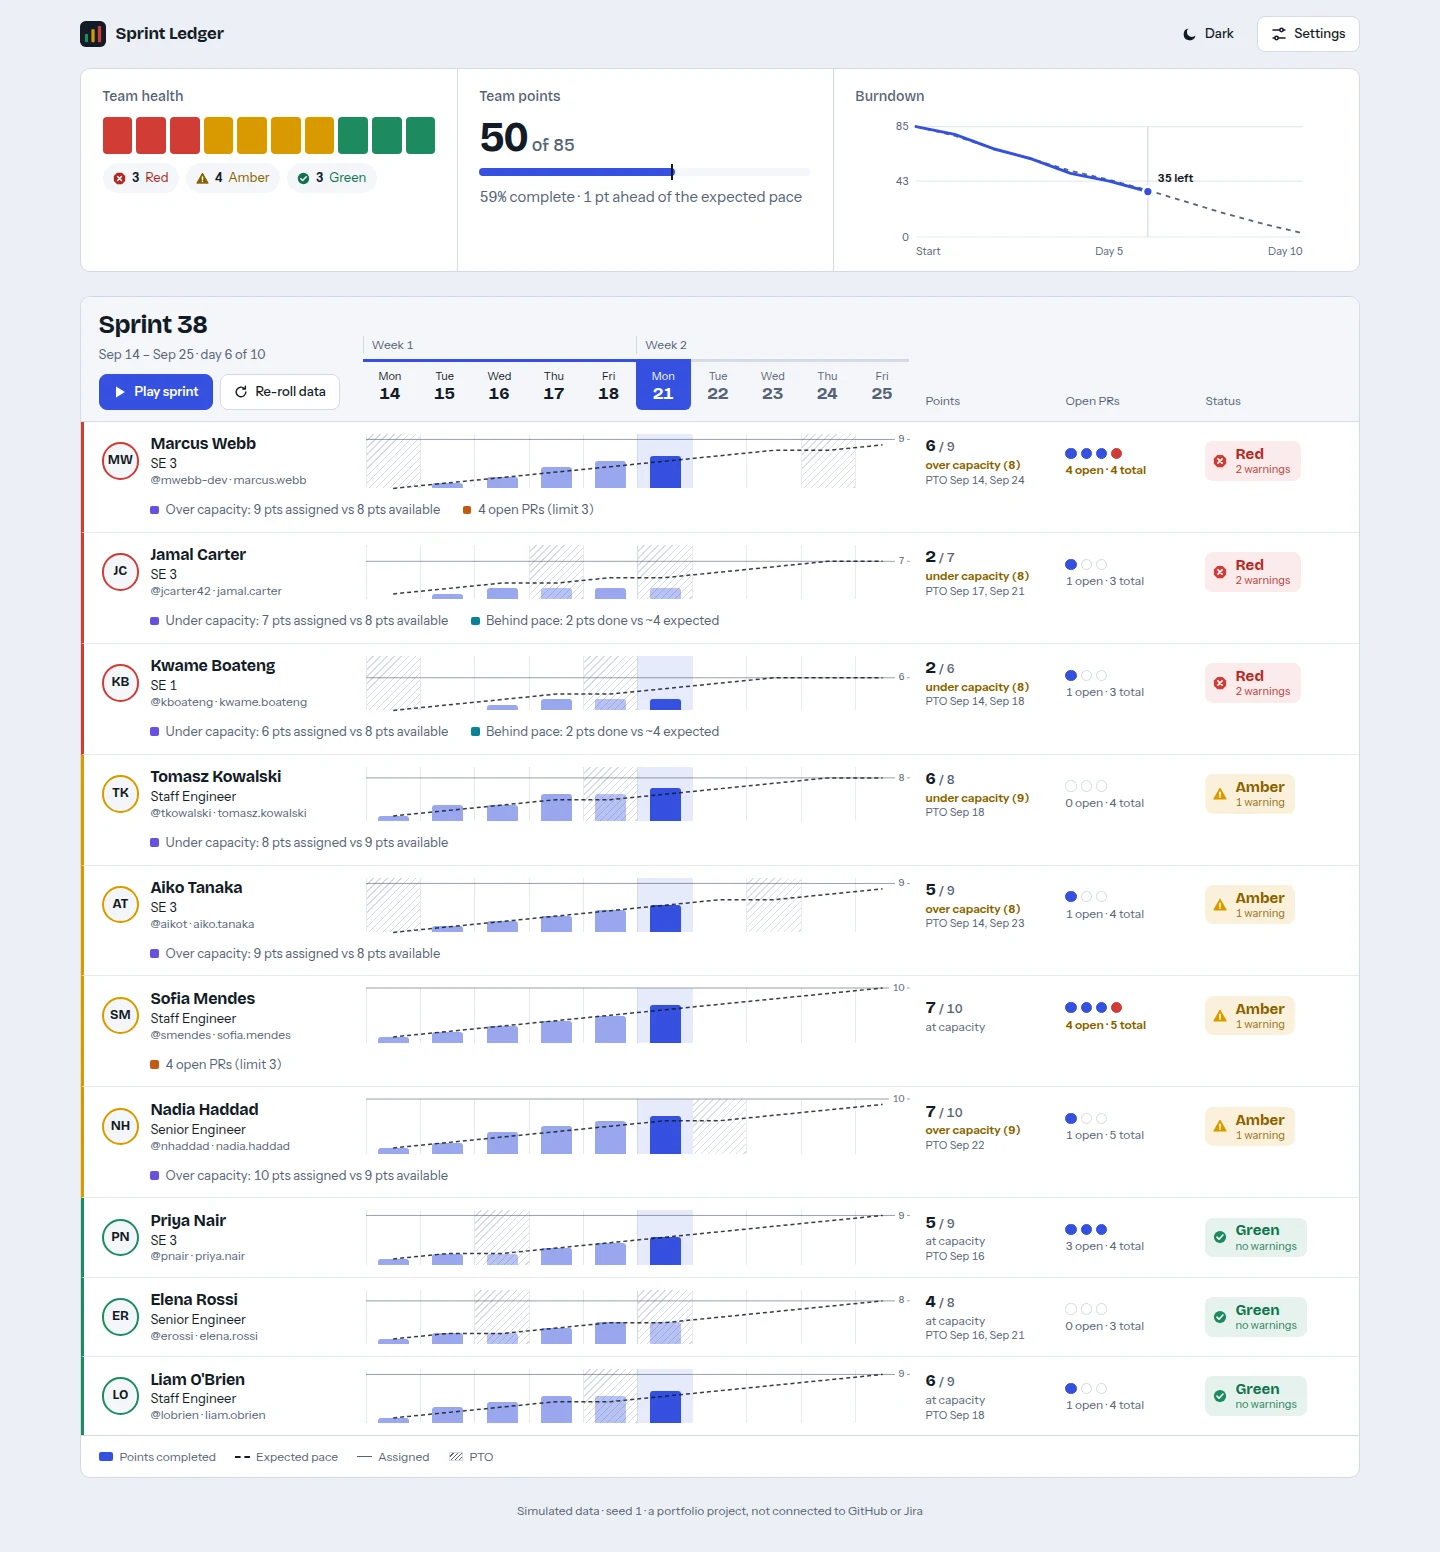
Playing the sprint or dragging the day scrubber shows how the picture changes from day to day.
Five choices that shaped it.
One shared time axis.
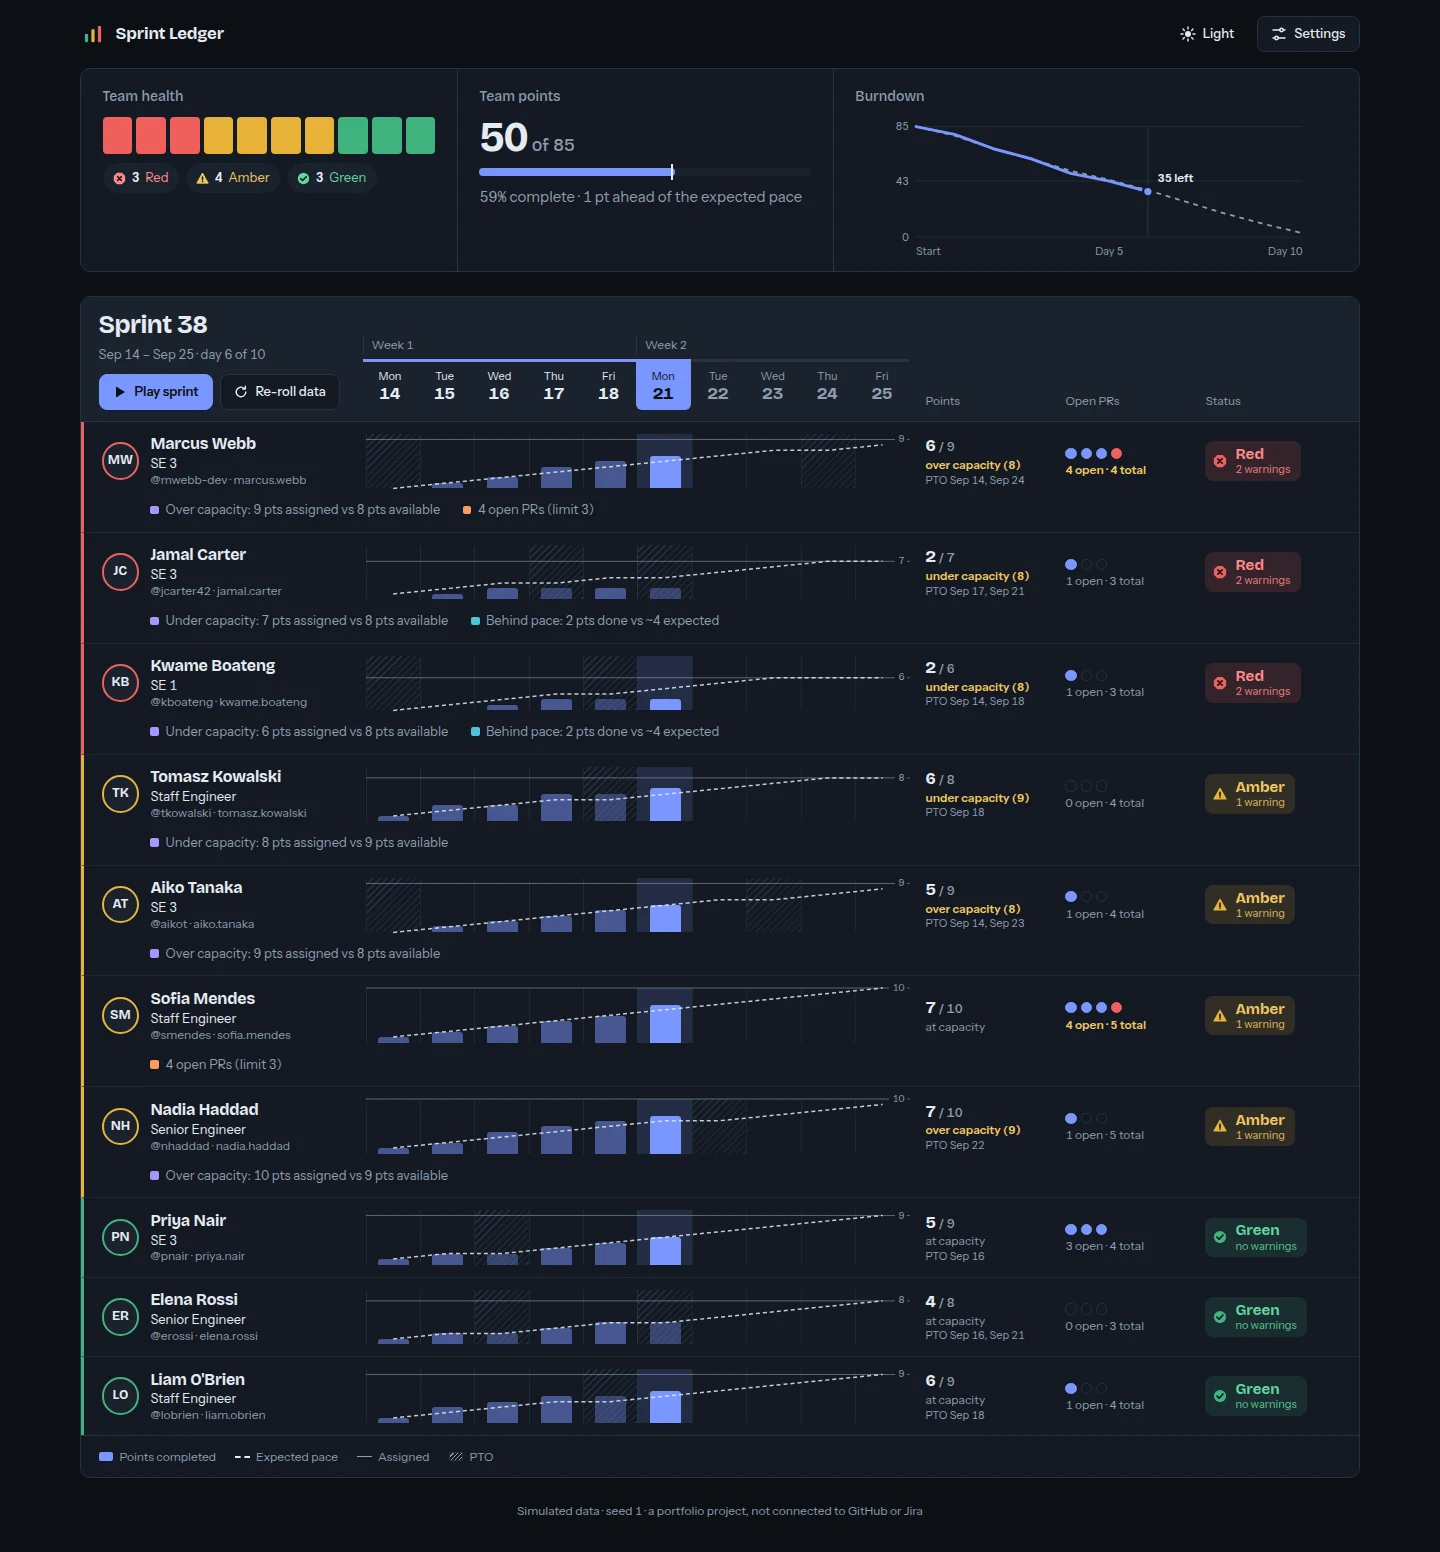
The day scrubber is the header of the lane board, so every person’s lane lines up under the same ten days. Bars show points completed, the dashed line is expected pace, and hatched cells are PTO.
Status never relies on color alone.
Each status has its own shape and label, and a written reason sits under the lane, so the board reads correctly for people who cannot tell red from green.
A deterministic simulation.
Each fictional person is given a work style (steady, ahead, behind, or a review backlog) by a seeded random generator, and the whole sprint is precomputed. Scrubbing back and forth is therefore consistent, and cumulative numbers only rise.
Coaching prompts stay with the person.
The talking points began as a team-wide panel. I moved them into each person’s detail drawer, so individual conversations are visible only when that person is opened.
Scoring is plain, tested code.
The simulation, scoring, and talking points are pure functions with no interface code, covered by 29 unit tests. Every status can be explained and checked.
How I used AI to build it.
Sprint Ledger was built with Claude as a coding partner, and the commit history records it as a co-author.
In this public version, the scoring and the coaching prompts are deterministic rules, not model output, so every status can be explained and tested, and the model’s role was in building the tool. The internal version at Fanatics went further: it ran on an hourly schedule, with Claude agents evaluating the live data and proposing one-on-one topics from what they found.
From simulation to real signals.
The roster already stores each person’s GitHub and Jira handles, which is the natural place to connect real pull-request and ticket data in place of the simulation. With real data in place, a language model could summarize trends across sprints, for example turning a run of Amber weeks into a short written brief for a manager to review.
I would keep the same boundary: rules decide the status, and any model-written summary is a draft for a person to check.
See it running.
Press Play sprint to watch a sprint unfold, or open a person to read the reasoning.